When does Halloween start (and end) exactly?
Observing the total number of Halloween visits to my house in 2018
Anthony Ionno
November 7, 2018
Summary
I thought I would run a fun experiment while my wife handed out candy this year and see when trick-or-treaters would start coming by our house for candy. It seems that prime candy-time starts around 6 and ends around 9. 7:00 pm is peak trick-or-treating time in my neighbourhood and I observed an increase in participant age as the night progressed.
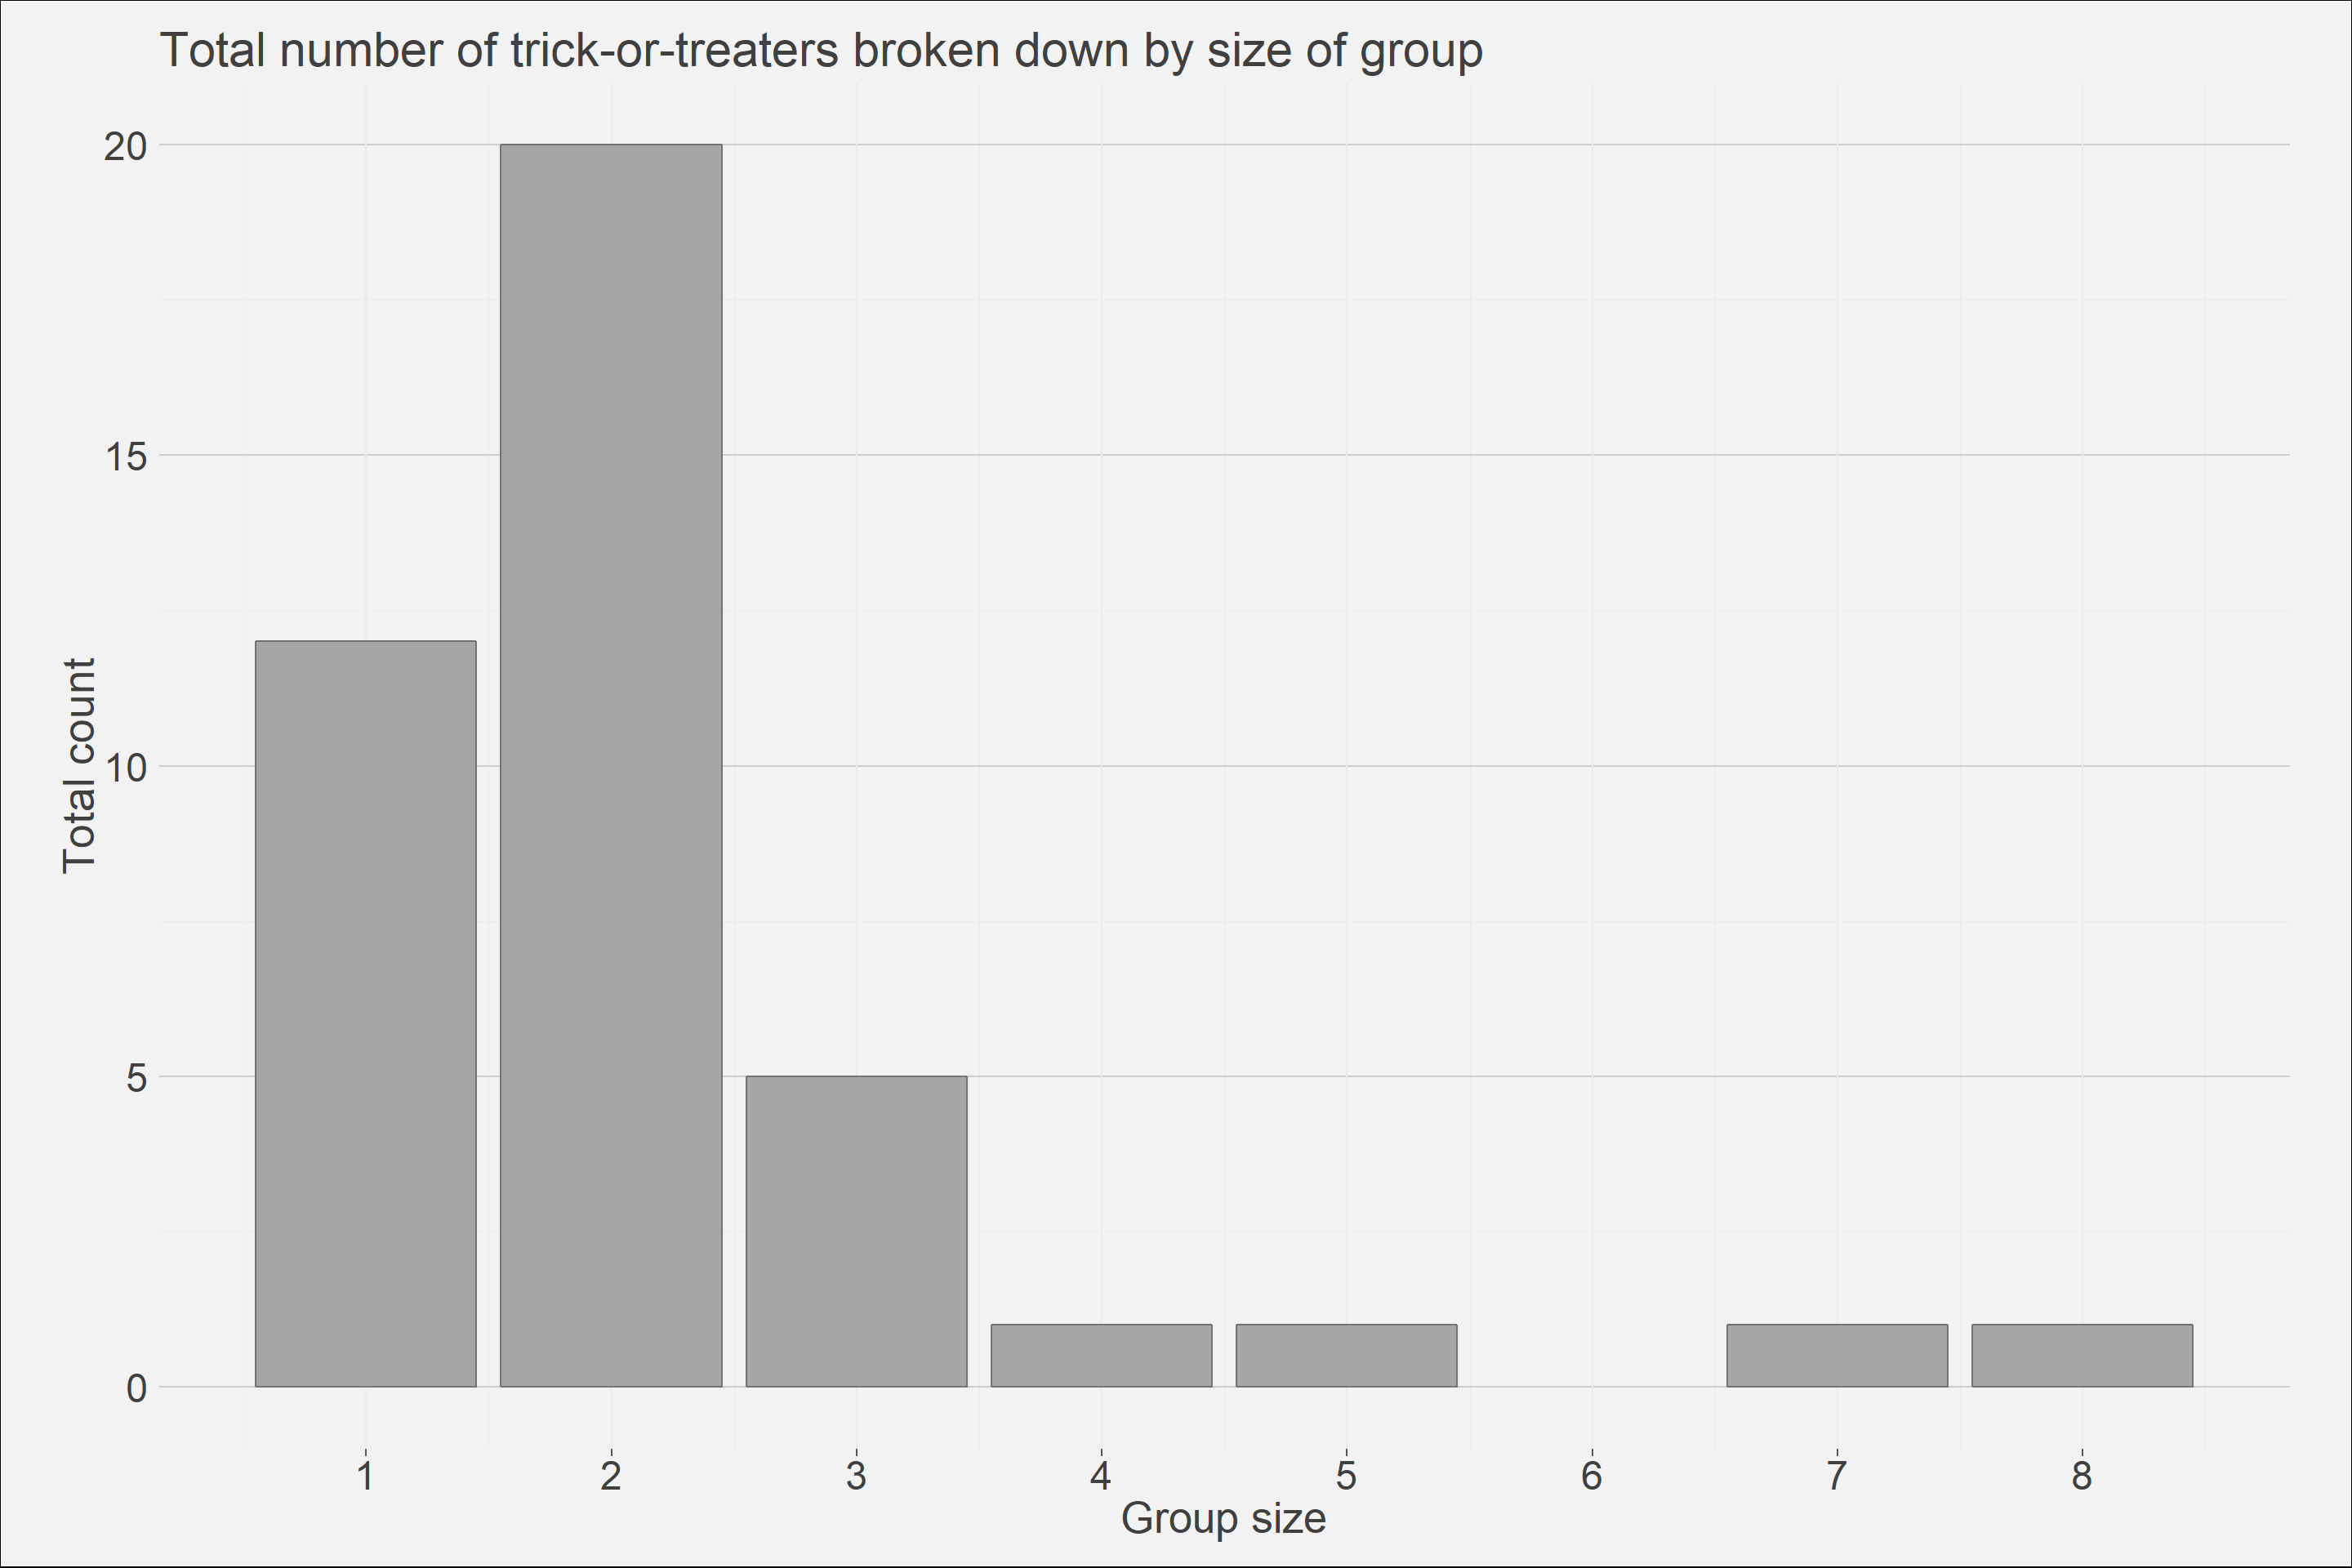
I also thought it would be fun to record the group sizes that arrived at my front-door during this period. Group sizes of 2 were the most common, followed by 1 and then 3. I did have two large groups of 7 and 8 that came early on but nothing larger than that.
R libraries
library(tidyverse);library(extrafont);library(extrafontdb);library(magrittr)Preprocessing
None whatsoever, I simply inputted the data from my notepad into a spreadsheet and fed that into R.
# Reading in data
df <- read_csv("2018-11-04_halloween data.csv")
# Creating custom plotting theme
theme_ai <- function(){
  theme_minimal() +
    theme(
      text = element_text(color = "gray25"),
      plot.title = element_text(size=22),
      plot.subtitle = element_text(size = 20),
      axis.text = element_text(size=18, color = "gray25"),
      axis.title = element_text(size = 20),
      plot.caption = element_text(color = "gray30", size=16),
      plot.background = element_rect(fill = "gray95"),
      plot.margin = unit(c(5, 10, 5, 10), units = "mm"),
      #axis.line = element_line(color="gray50")
      axis.ticks.x = element_line(color="gray35"),
      panel.grid.major.y = element_line(colour = "gray80"),
      legend.position = "none")

}
Analysis
temp<- df %>% group_by(Hour) %>% summarise(num_tt = sum(Count))
ggplot()+
  geom_bar(data = df, aes(x = Hour, y = (..count..)/(..count..)*temp$num_tt), fill='gray65', color = "gray45")+
  theme_ai()+
  labs(title = "Total number of trick-or-treat visitors broken down by hour",
       x = "Hour of the day",
       y = "Total count")+
  scale_x_continuous(breaks = c(1:8))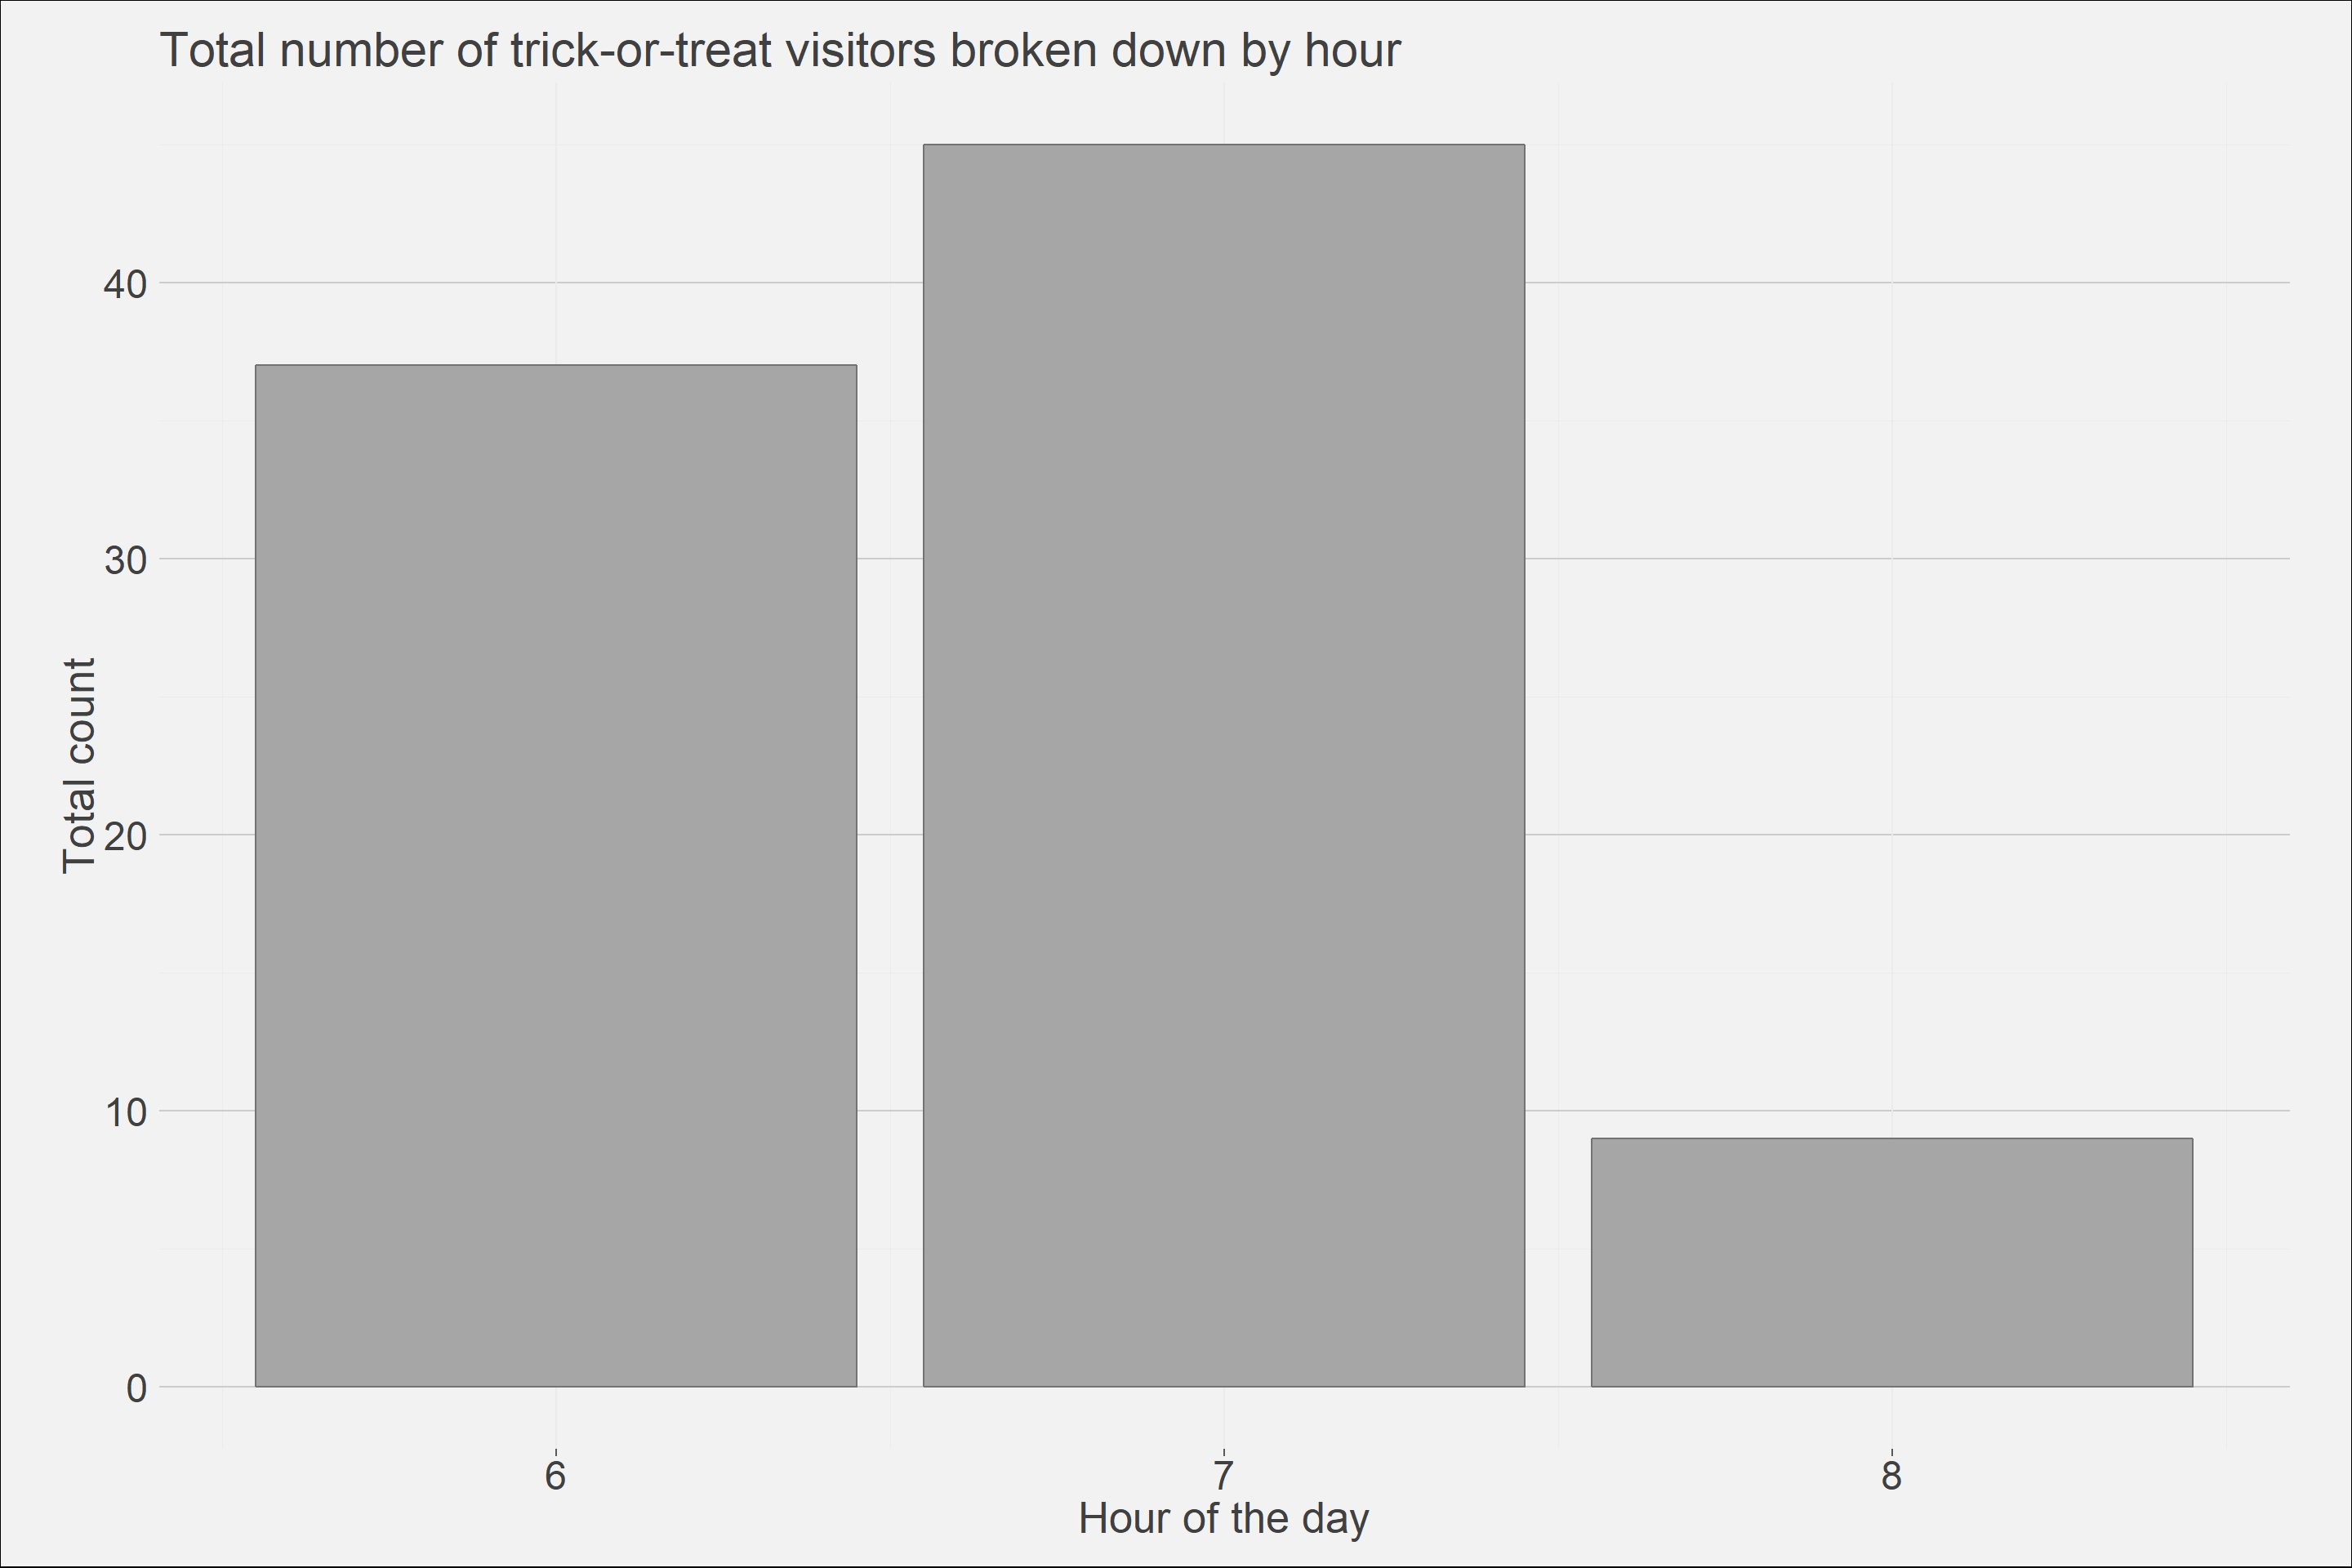
ggplot()+
  geom_bar(data = df, aes(x = Count, y = ..count..), fill='gray65', color = "gray45")+
  theme_ai()+
  labs(title = "Total number of trick-or-treaters broken down by size of group",
       x = "Group size",
       y = "Total count")+
  scale_x_continuous(breaks = c(1:8))