
I swear that fire hydrant wasn’t there (1 of 2)
Published:
Visualizing parking ticket data in Toronto.
Introduction
Have you ever wondered whether you should take the risk and sit for another fifteen minutes sipping coffee at the hipster café you are at or frantically run back to your car and put more money into the parking meter so you don’t get a ticket? Well, this post won’t answer whether you should or shouldn’t make that decision, but it might help you make a more informed choice. I was exploring the City of Toronto’s open data web portal and found this data set on parking tickets and thought it would be a fun exercise to work through.
The dataset contains eight years’ worth of parking ticket information on approximately 23.3 million tickets issued from 2008 through 2016. Additional information on this dataset can be located on the City of Toronto’s website.
The purpose of this analysis is for me (and hopefully you) to learn more about how parking tickets are distributed within the City of Toronto and also create some hypotheses that I can either verify or discard. Some questions I thought about when starting to work through this data:
- Is an individual more likely to receive a parking ticket at one period of the day rather than another?
- Where are individuals most frequently ticketed?
- What is the most frequent parking infraction?
The majority of the data cleaning and analysis for this post was done in R and then outputted into a series of excel files where graphics were developed. Each parking ticket file contains date, location, infraction, and fine information. Additional time variables were created for hourly groupings that will appear later in this post.
Summary of the Data
As mentioned previously, this data spans from 2008 through 2016 and contains approximately 23.3 million parking ticket records. The median fine amount in the dataset was $30, 75% of the fine amounts were under $40, and the max fine was $450. Figure 1 shows the total number of parking tickets and fines broken down by year. The left-hand side of the figure corresponds to parking tickets and the right-hand side corresponds to fines due to parking tickets. Total parking tickets and fine amounts are consistently between 2.5 to 3 and 110-115 million until 2012 and then drop drastically in 2014 and seem to increase in 2015 through 2016. The drop in ticket fines between 2012 and 2014 is drastic and represents an almost $11 million dollar or 11.7% decrease in total fines between those two years; the decrease in parking tickets between those periods is also substantial, a decrease of 500,000 or 18.5%. The description of the dataset on the website says “Approximately 2.8 million parking tickets are issued annually across the City of Toronto.” while this appears to be valid for the first six years of the dataset, it doesn’t appear to be true for the remaining three.
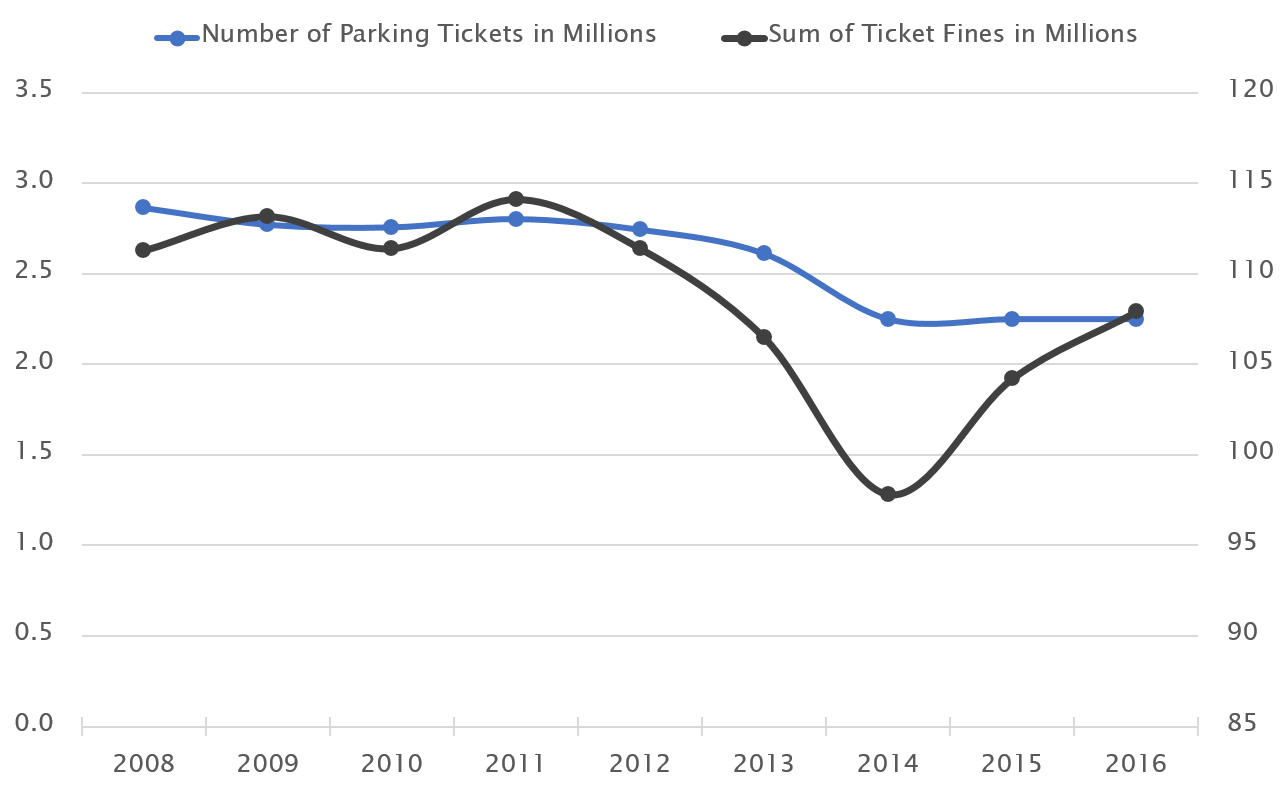
Figure 1: Total Number of Parking Tickets and Fines Broken Down by Year
Figure 2 provides a more detailed breakdown of the allocation of fine amounts across all years in the data set. Four fine amounts: 15, 30, 40, and 60 dollars comprise almost 94% of all tickets fines from 2008 through 2016. The data also shows that 2,194 tickets with a value of 0 dollars were issued between 2008 and 2016.
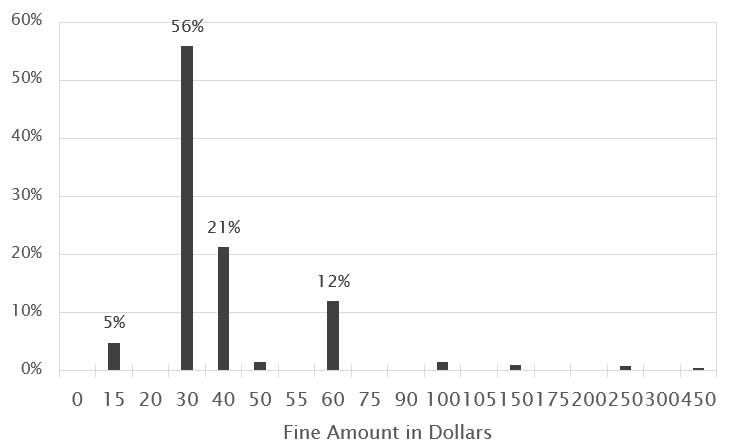
Figure 2: Percentage of Total Tickets Issued from 2008 through 2016 Broken Down by Fine Amount
The total amount of tickets issued for these top four fine amounts is distributed fairly even across each year in the dataset with a min and max of 8 and 13 percent in 2016 and 2008. This is unlike the 50 and 150 dollar fine amounts that see a massive increase in tickets issued starting in 2014 and 2015. The 50 dollar fine amount has 65 percent of its tickets issued in 2016; the 150 dollar fine amount has 99 percent of its tickets issued from 2014 through 2016.
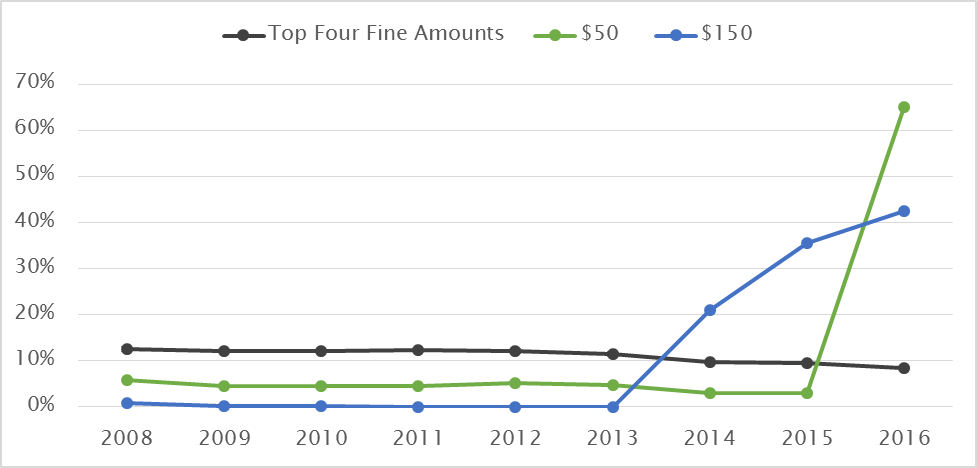
Figure 3: Percentage of Total Tickets Issued by Fine Amount Broken Down by Year
Now that I have worked through a brief summary of the data, I think it’s time to try and get at one of the questions I posed earlier. So, should we expect to an individual to be ticketed more frequently at one time of the day rather than another? I mean, I think the obvious answer is yes, people are around more during working hours, during the day, and on weekends. So I expected to see some sort of difference.
Figure 2 below shows average annual parking tickets issued, broken down by hour of the day. An hour in this figure is defined from 0 to 23, where hour 0 represents 12 to 1am and hour 23 represents 11pm to 12am. This convention is defined as “hour-beginning” as opposed to “hour-ending”.
Based on the figure below you can observe several period of time throughout a weekday where there is an increase in ticketing activity. The most dramatic increase starts at 6am until 1pm. Incidence of ticketing then appears to decrease monotonically after that point in time. On weekends the hour with the highest occurrence of ticketing is between 12am and 1am.
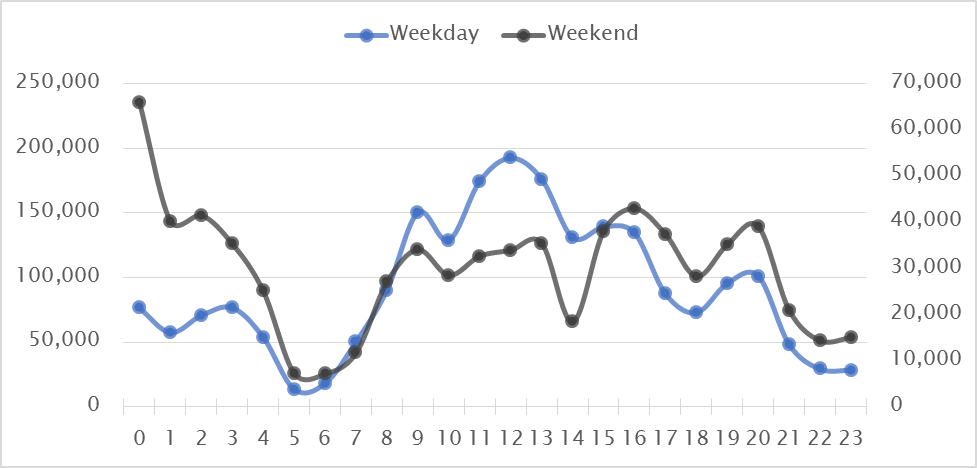
Figure 4: Average Annual Tickets Issued Broken Down by Hour
The list below contains each of the streets that had the highest number of tickets issued for the years covered in the dataset.
- Yonge Street;
- Queen Street West;
- Queen Street East;
- King Street West;
- Danforth Avenue; and
- Bloor Street West.
Yonge Street, Bloor Street West, and Danforth Avenue appear every year in the top five. King Street West replaces Queen Street East in 2009, 2011, and 2012. Fine amounts on these streets are similar to the amounts mentioned previously, the median fine amount is $30, 75% of customers are being charged under $40 for a ticket and the maximum fine received is $450. Figure 3 compares the average annual parking tickets, broken down by hour for the top five streets against the graph in Figure 5.
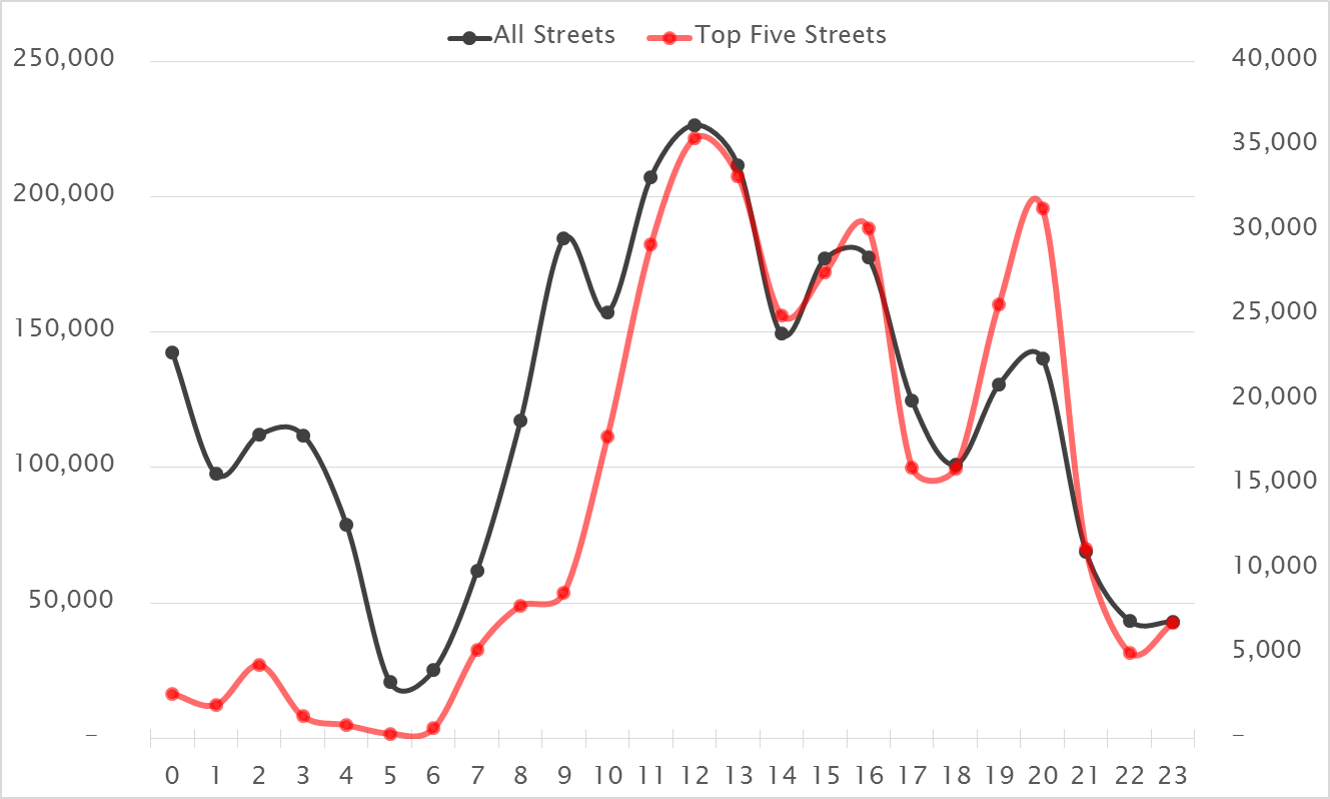
Figure 5: Average Annual Tickets Issued Broken Down by Hour
You could also approach this question differently looking at specific addresses within the city. For the above analysis, I removed exact location because I thought I wouldn’t be able to get web mapping (interactive) applications to work properly on my blog.
I am so happy that I was wrong :D so check out my next post to see me put Leaflet to work.